Call Statistics
During video calls, swyMed collects statistics to help you understand and troubleshoot possible quality issues with a meeting. In most cases, problems arise from the network or one of the computers involved. By providing real-time information on how well swyMed is running on your device and network, the statistics panel can help you diagnose issues quickly and efficiently.
Meeting statistics are displayed as a graph of one participant's data.
Click on any image below to view the full-size version. Click outside the image to return to these directions.
Click to jump to a section:
Call Statistics Terminology
Round Trip Time (RTT)
The length of time, in ms, that it takes for a signal to be sent from the user's computer to the swyMed conferencing server and for an acknowledgment of that signal to be sent back to the user's computer. A long RTT typically results from network congestion. SwyMed automatically adjusts to optimize the RTT.
SD
Standard deviation
Audio/Video Jitter
Variability ("Jitter") in the quality of data packet transmission; if the jitter is greater than about 50 msec, this can result in poor call quality.
Packet Loss
A "packet" refers to a unit of audio, video, and other data that swyMed sends over the computer network. Sometimes, packets disappear due to congestion on the network router or switch ("lost packets") or delayed arrivals on the local jitter buffer ("discarded packets").
Upload
Data upload rate in kbps
Download
Data download rate in kbps
Global CPU usage
Total CPU usage for the user's device
Global Kernel usage
Portion of total CPU usage that was consumed to support hardware
CPU used by call
The CPU usage consumed by the video call
Kernel used by call
The percentage of hardware usage that is consumed by the video call
Video
Resolution of the user's video image and number of video frames sent per second (FPS)
Viewing Call Statistics during a Call
To view call statistics:
-
On the in-call toolbar at the top of the screen, click or tap the Help button.

-
Click or tap the Call statistics button.

-
Select the user whose statistics you want to view.
-
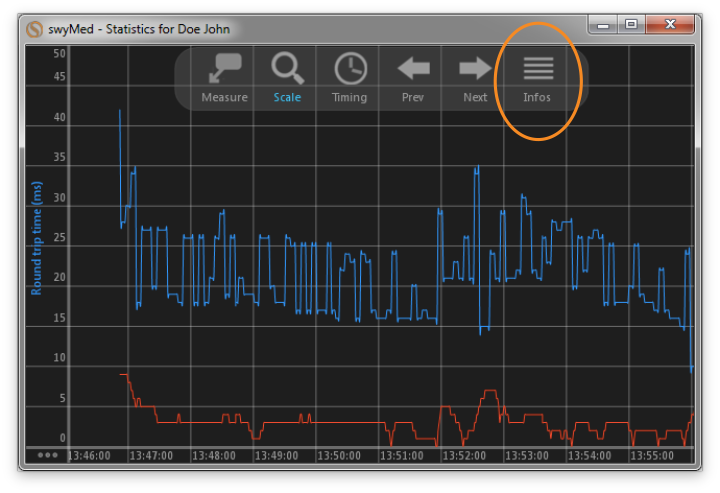
A pop-up window will display a graph of the round trip time (blue) over time. When you view your own graph, you will also see the round trip standard deviation (SD) in red.
-
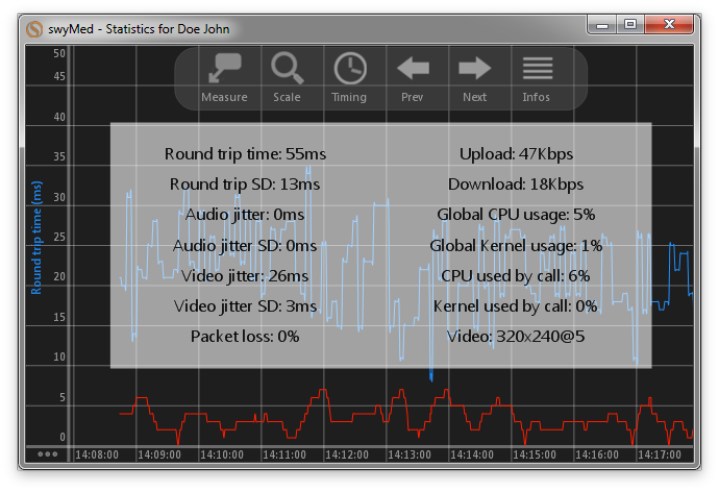
To view more detailed data, click the Infos button. For an explanation of the terminology, refer to the table above.